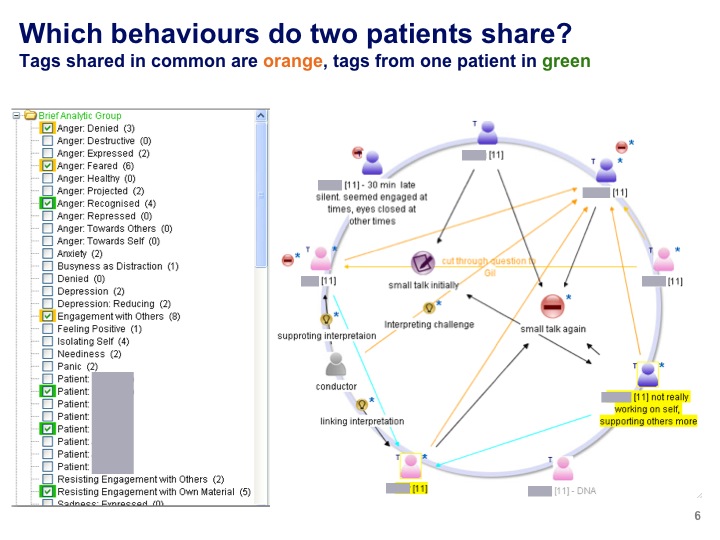
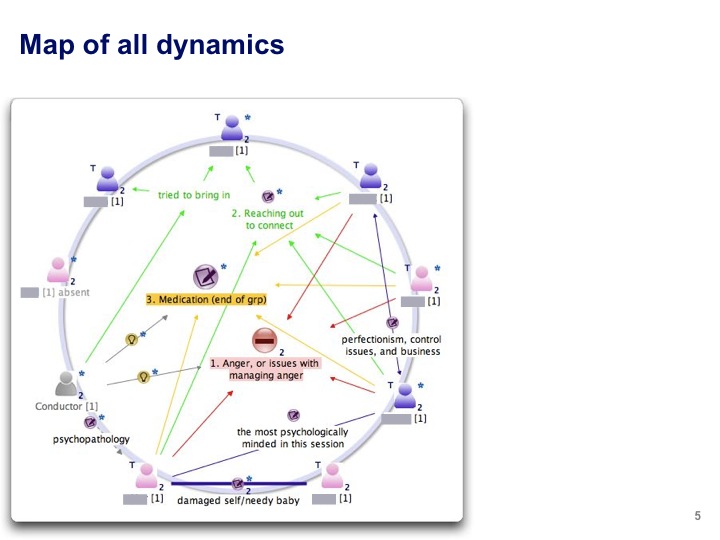
In recent work with psychotherapists, we’ve been using Compendium to convert their usual notes from analytic group sessions, into maps that reflect key aspects of the group dynamics.
The Compendium design team has always envisaged the tool as analogous to spreadsheets for ideas: “Excel for Knowledge” if you will. Instead of handy tools for working with numbers, the vision is for an intuitive tool providing scaffolding for rendering, linking, structuring, categorising and debating ideas, with a customisable user experience, without knowing in advance what the domain of application will be.
We could map participant interactions in any drawing package, of course, but Compendium has a full database behind it: nodes and links are hypertext elements, not just dumb graphical objects. Compendium’s ability to design and assign combinations of tags (keywords, equivalent to qualitative data analysis codes), coupled with node embedding (rendering a given node in the network in multiple views), offers the prospect of conducting longitudinal comparative analyses across sessions, at both the individual and group levels.
The blog post below provides more details and examples, with commentary on how we used Compendium’s different elements to create this vertical application
Related Links: